Applying machine learning algorithms to enhance wildfire prediction in Alaska
Supervised learning with low computational power to forecast next-day natural wildfire occurrence from ERA5-Land weather data — XGBoost reached 82.9% accuracy in under two minutes.
Challenge
Wildfires have tremendous impacts on global biodiversity and health, and lead to losses of lives and property [1]. In 2021, wildfires and other natural catastrophes caused 270 billion USD in loss [2]. Under climate change, the frequency of wildfires is expected to rise [3], and there is an increasing need to understand and forecast them [4]. Recently, deep-learning algorithms have been introduced for prediction [5]; however, they tend to be computationally demanding and time-consuming [6][7].
In this work, supervised machine-learning algorithms with lower computational power are implemented to predict natural wildfire occurrences in Alaska with a lead time of 1 day, based on weather conditions.
Method & Standards
🗺️ Study area & period
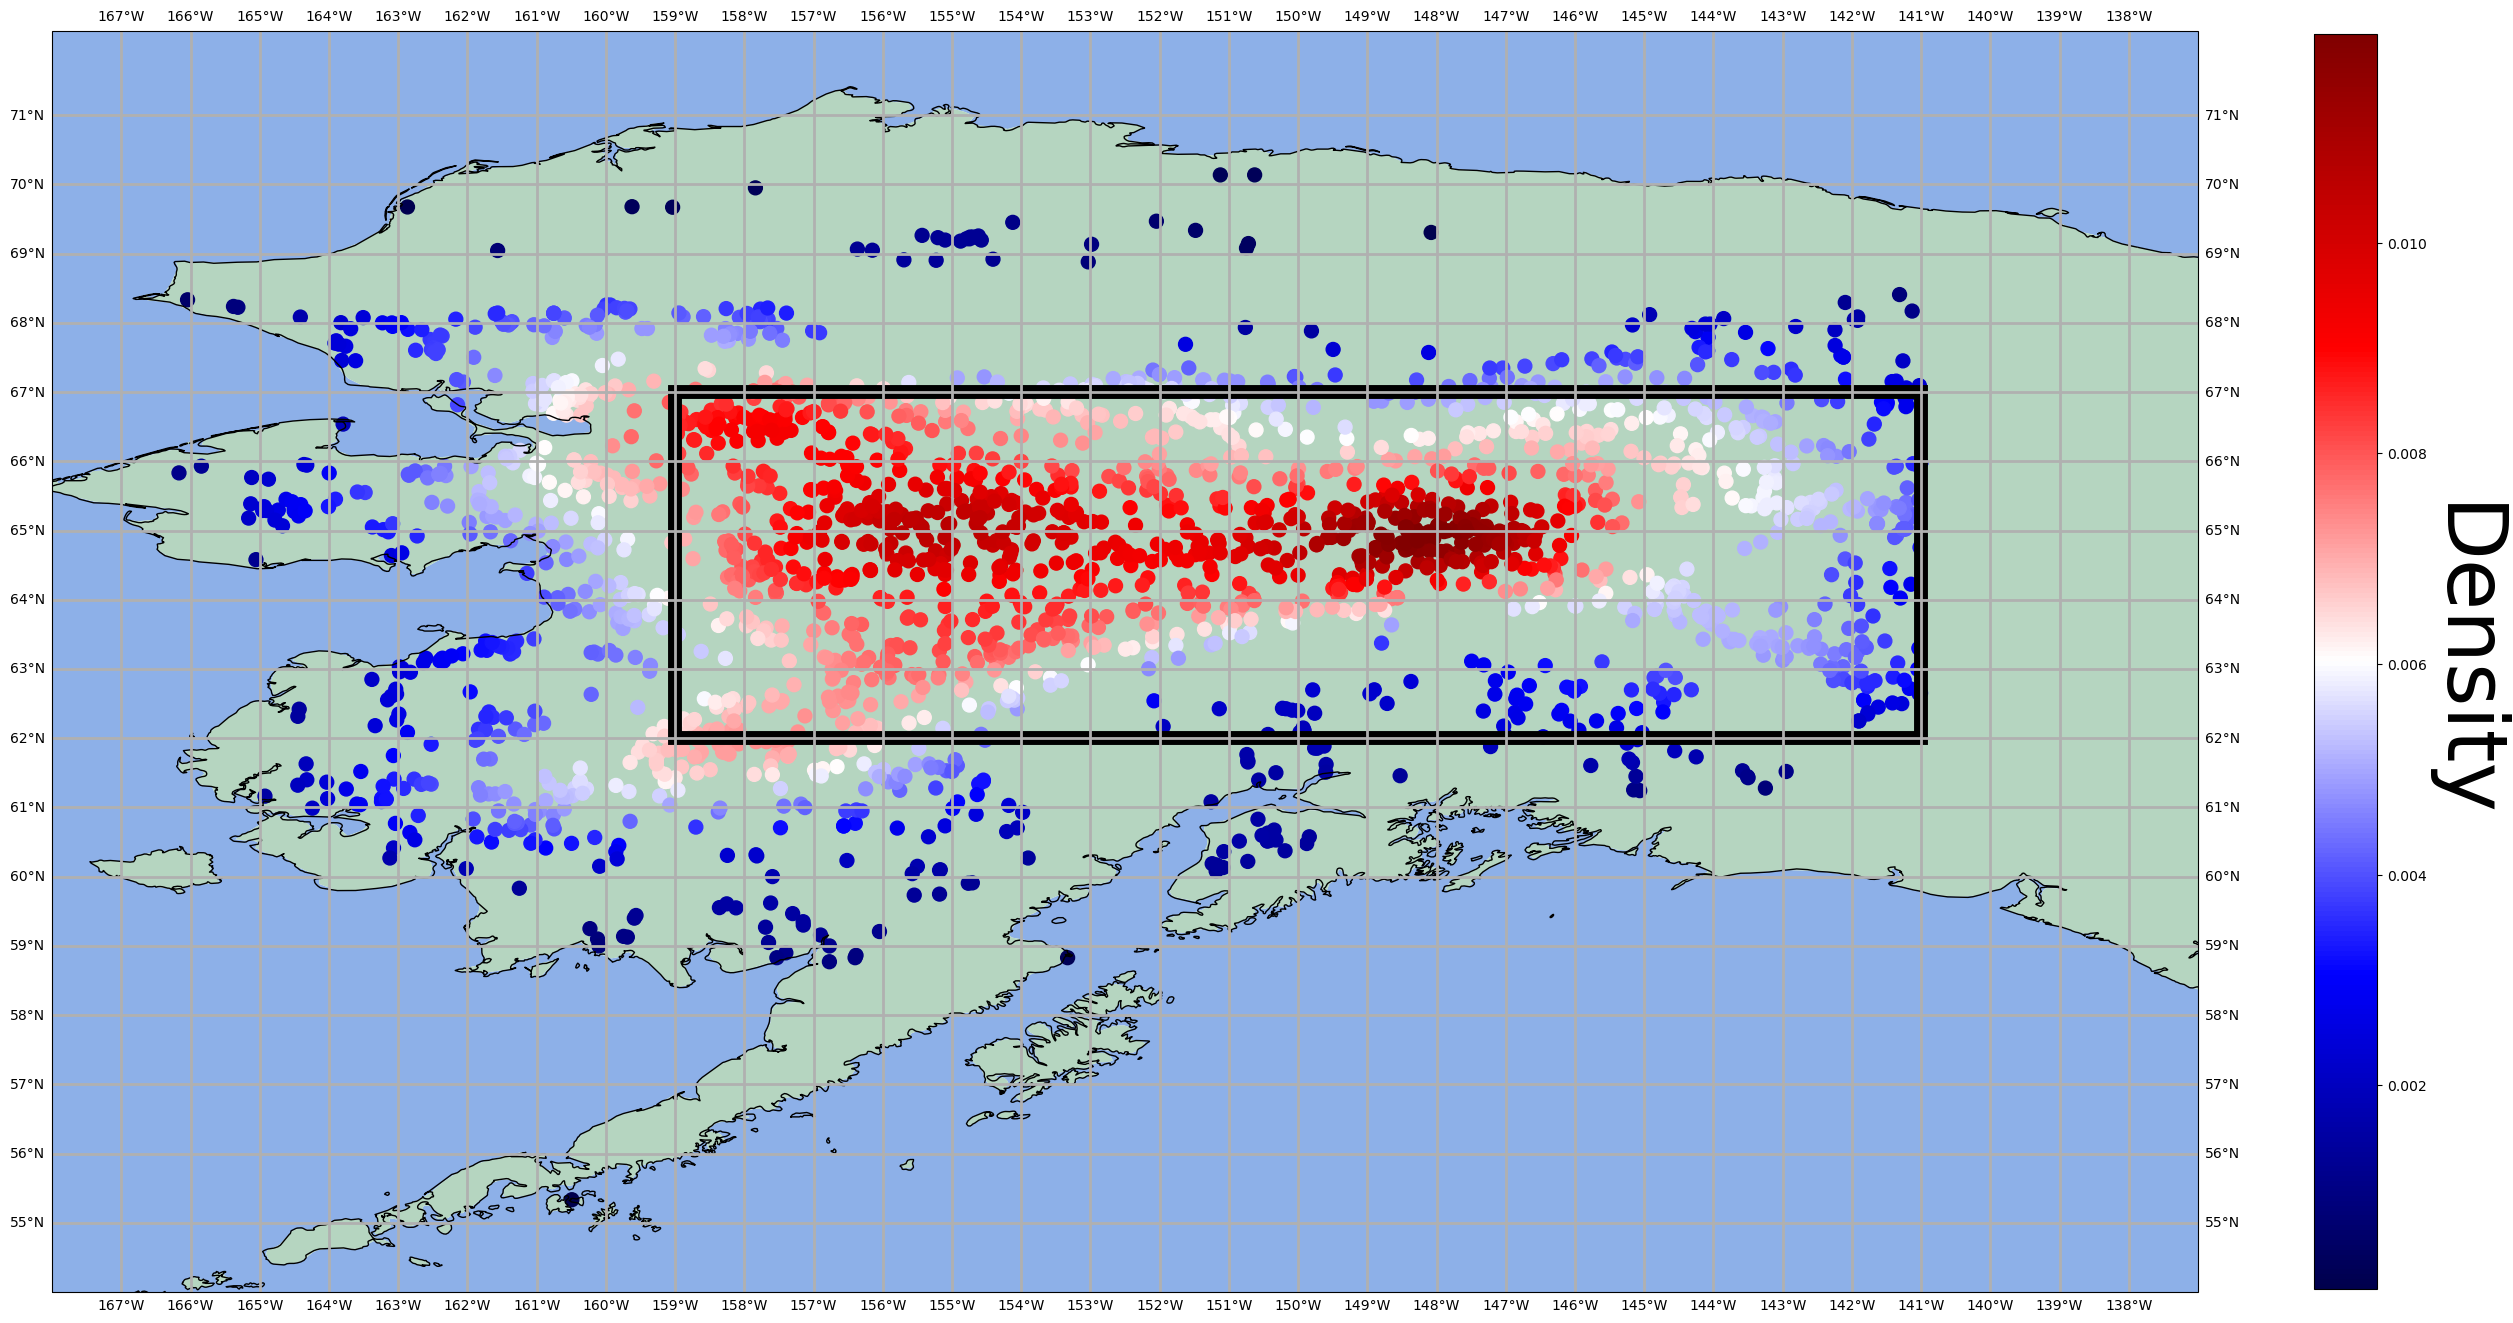
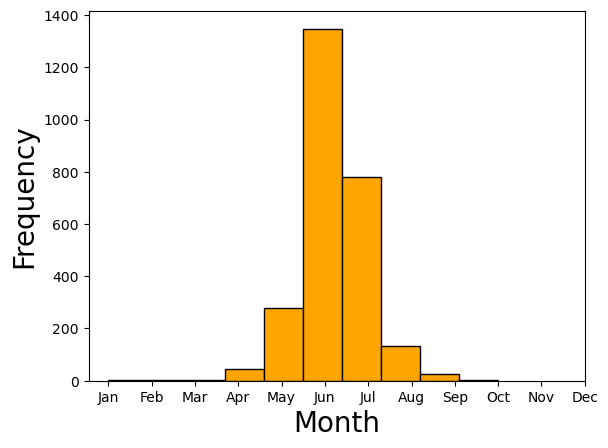
Situated at high latitude, Alaska is particularly vulnerable to climate change [8]. This work studies the region and months with the highest wildfire intensities from 2010 to 2020: 62°N–67°N, 141°W–159°W, during May to August. The target data format is gridded data with a spatial resolution of 9 km and a daily temporal resolution.
📚 Datasets
| Dataset | Spatial resolution | Temporal resolution | Spatial data type |
|---|---|---|---|
| ERA5-Land | 9 km | Hourly | Gridded |
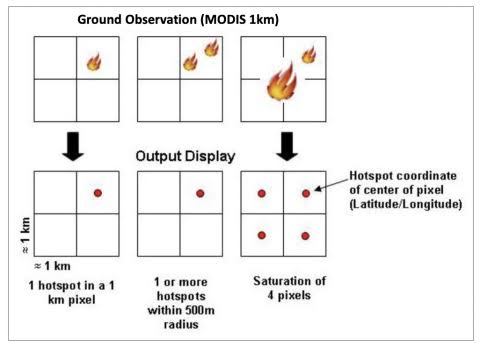
| MODIS Burned Area Product | 2.3 km | 11 days | Multipolygon |
ERA5-Land provides hourly humidity, temperature, precipitation, and wind speed. MODIS Burned Area Product and spatial wildfire-occurrence data for the United States supply fire history and burned-area information.
🧮 Data preprocessing
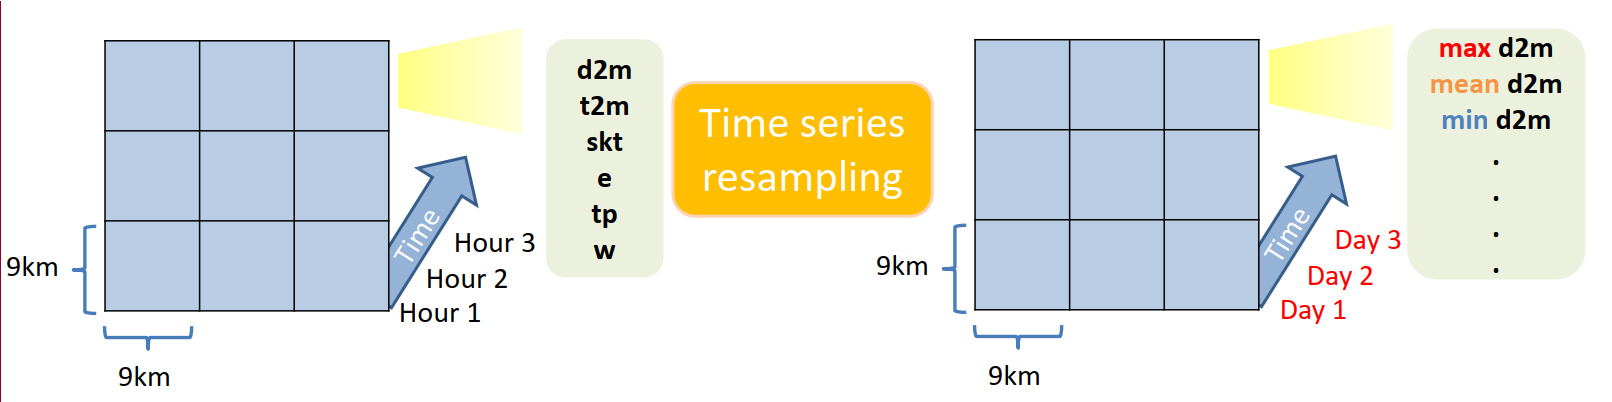
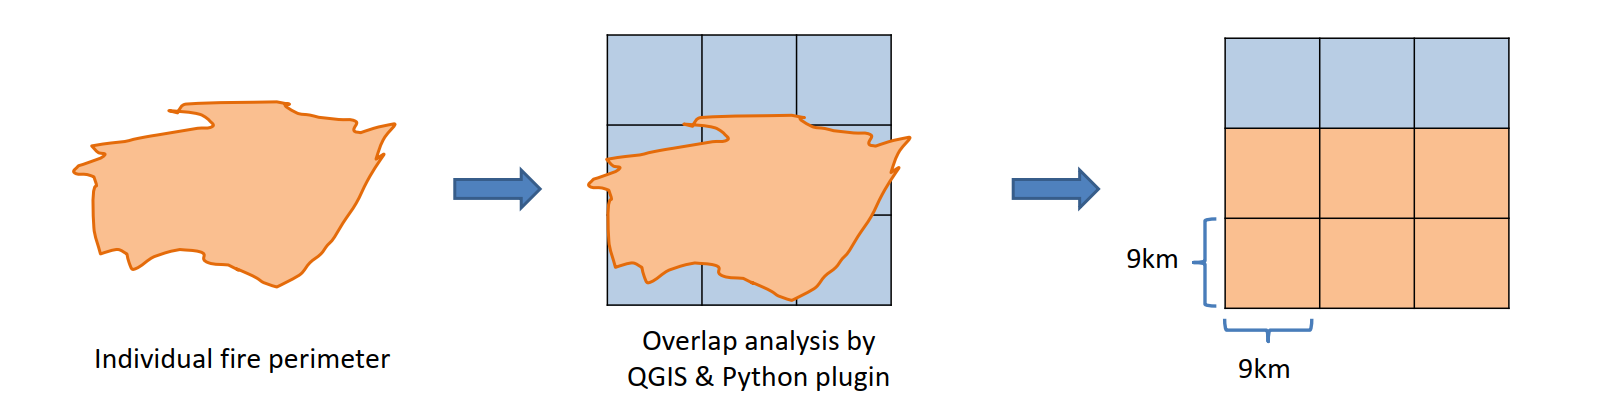
Variables d2m, t2m, skt, e, tp, and 10 m wind (w) are resampled from hourly to daily form. Burned areas are intersected with US wildfire-occurrence data to determine the start date of each fire; fire perimeter data are transformed from multipolygon to gridded data via QGIS overlap analysis with a custom Python plugin.
📈 Attribute analysis & data cube
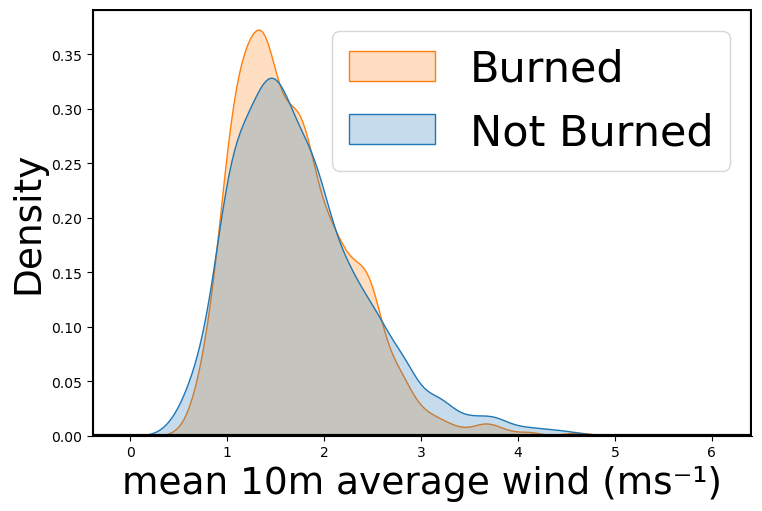
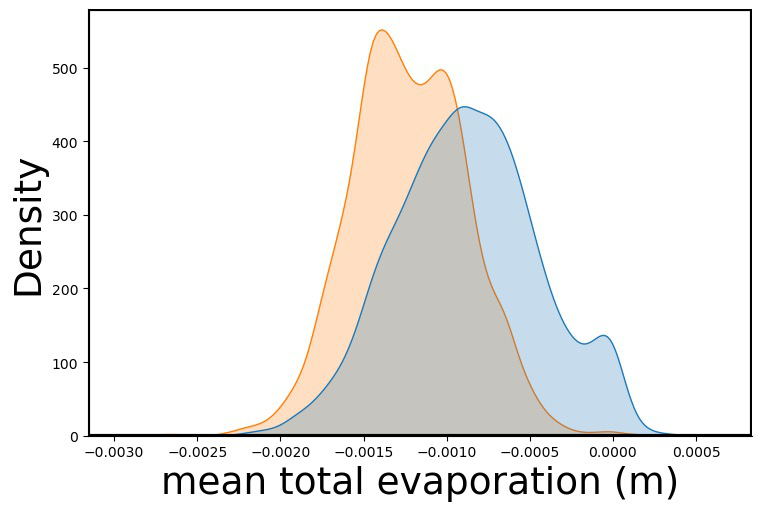
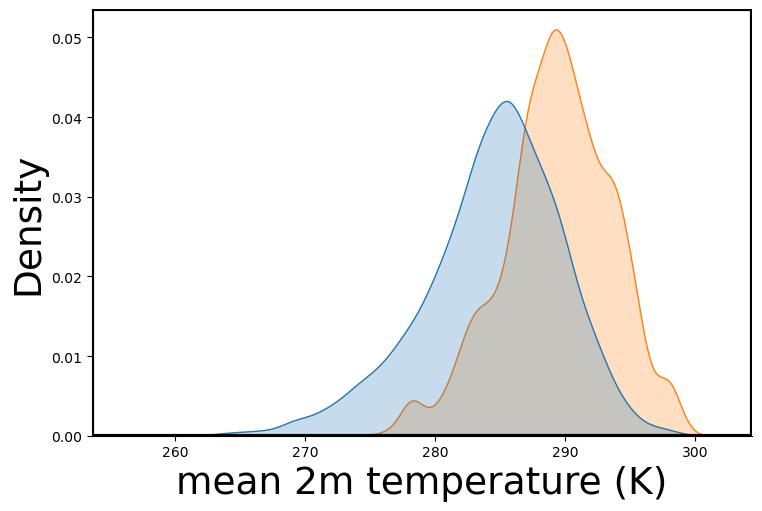
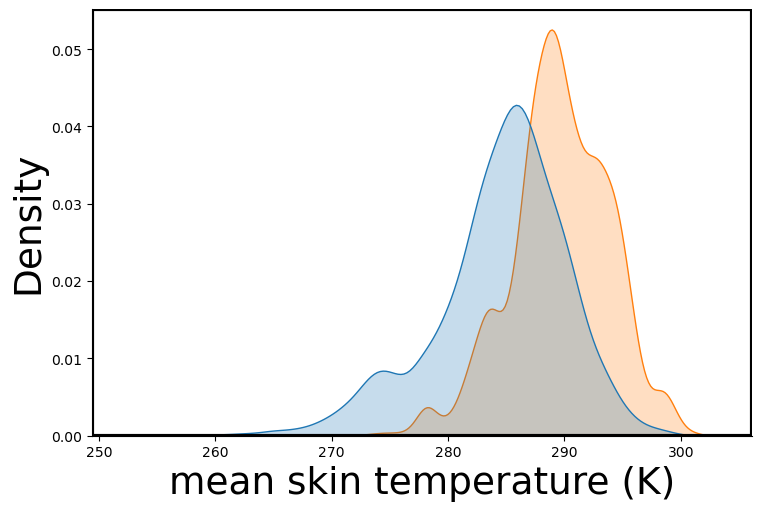
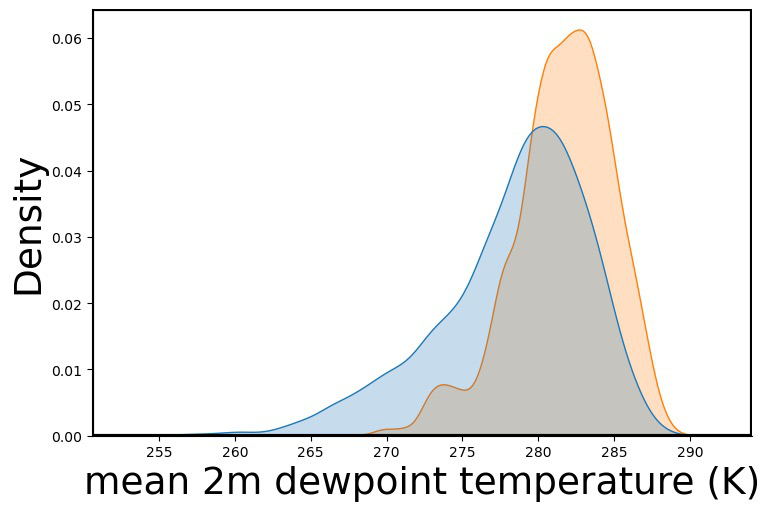
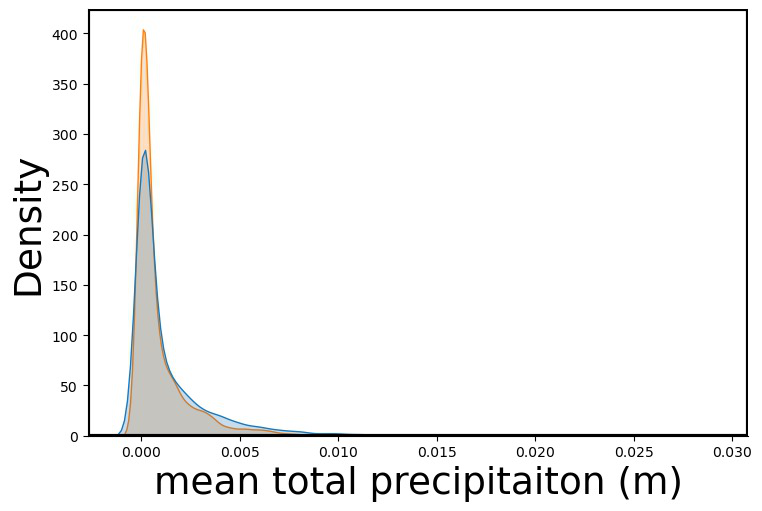
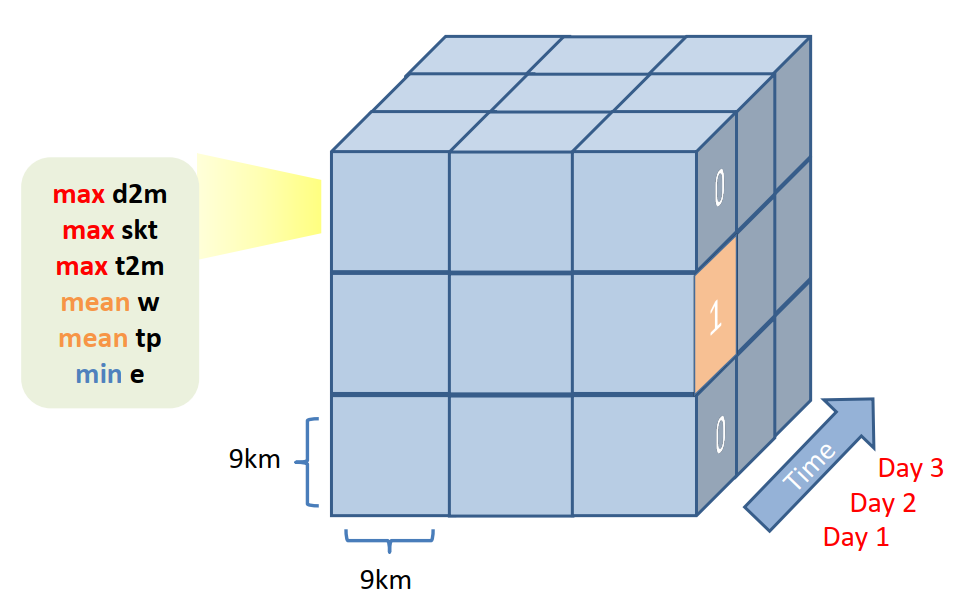
Before model training, attribute analysis identifies the significant values of each weather variable for distinguishing burned from unburned cells the next day, minimizing computational power. At 9 km resolution, the prediction of next day's burned value (0 or 1) is based on: min evaporation (mine), mean wind speed (meanw), max 2 m temperature (maxt2m), max skin temperature (maxskt), max 2 m dewpoint temperature (maxd2m), and mean total precipitation (meantp). As the dataset is imbalanced, random undersampling of non-burned cells is carried out to avoid overfitting — the final ratio of burned to unburned cells is 1:1. The dataset is split 60%/40% train/test and a 5-fold cross-validation is performed for each model, with random undersampling each time.
Visual / Demo
| Model | Mean CV Score (%) | Accuracy (%) | Precision (%) | Recall (%) | F1 (%) | Execution Time (s) |
|---|---|---|---|---|---|---|
| Decision Tree | 79.86 | 80.12 | 77.98 | 82.69 | 80.26 | 114.78 |
| XGBoost | 81.86 | 82.90 | 80.24 | 86.26 | 83.14 | 68.56 |
| Support Vector Machine | 71.82 | 71.26 | 67.48 | 79.57 | 73.03 | 59.67 |
| Random Forest | 75.80 | 76.57 | 73.13 | 82.34 | 77.46 | 64.90 |
| Naive Bayes | 71.44 | 72.59 | 67.91 | 83.29 | 74.82 | 49.33 |
Metrics: precision = TP/(TP+FP), recall = TP/(TP+FN), F1 = 2·precision·recall/(precision+recall), accuracy = (TP+TN)/(TP+FN+TN+FP).
Impact
- • Within two minutes, simple machine-learning models — particularly XGBoost — can predict next-day wildfire occurrence with an accuracy of 82.9% using weather conditions.
- • Low-power ML algorithms can serve as fast, efficient alternatives for predicting natural hazards under climate change, potentially enhancing climate resilience.
- • Improvements: longer lead times, higher spatial resolution, and static variables such as slope and vegetation index to improve accuracy.
References
[1] Westerling, A.L. (2007). Climate change and wildfire in California. Climatic Change 87(S1), 231–249. doi.org/10.1007/s10584-007-9363-z
[2] Bevere, L. (2023). Natural catastrophes in 2021. Swiss Re sigma. swissre.com
[3] Ghorbanzadeh, O. (2018). Wildfire susceptibility evaluation… Advances in Science, Engineering and Technology.
[4] Taylor, S.W. (2013). Wildfire prediction to inform fire management. Statistical Science 28(4). doi.org/10.1214/13-sts451
[5] Arinta, R.R. (2019). Natural disaster application on Big Data and machine learning: A Review. ICITISEE. doi.org/10.1109/icitisee48480.2019.9003984
[6] Liang, H. (2019). A neural network model for wildfire scale prediction. IEEE Access 7. doi.org/10.1109/access.2019.2957837
[7] Jaafari, A. (2019). Hybrid artificial intelligence models… Agricultural and Forest Meteorology 266-267. doi.org/10.1016/j.agrformet.2018.12.015
[8] Markon, C. (2018). Chapter 26: Alaska. Fourth National Climate Assessment, volume II. doi.org/10.7930/nca4.2018.ch26