Capability of CPAS in predicting tropical cyclone in the Indian Ocean — Tauktae
Using the variable-resolution global model CPAS to predict the track and intensity of Cyclone Tauktae, one of the strongest storms ever to hit India's west coast.
Challenge
On May 13, 2021, an area of low pressure was detected in the Arabian Sea that turned into a deep depression on May 14. This led to the development of Tauktae — one of the strongest tropical cyclones to hit India's west coast. The North Indian Ocean generates only about 7% of the world's tropical cyclones (NASA, 2021), but they can be devastating due to the large number of people living along low-lying coastlines. Tauktae caused heavy rainfall and flash floods in areas along the coast of Kerala and on Lakshadweep, resulting in 169 deaths and 81 missing people in India (TOI, 2021).
The aim of this project is to discuss CPAS's capability in predicting cyclone development in the Indian Ocean.
Method & Standards
🌀 Forecast configuration
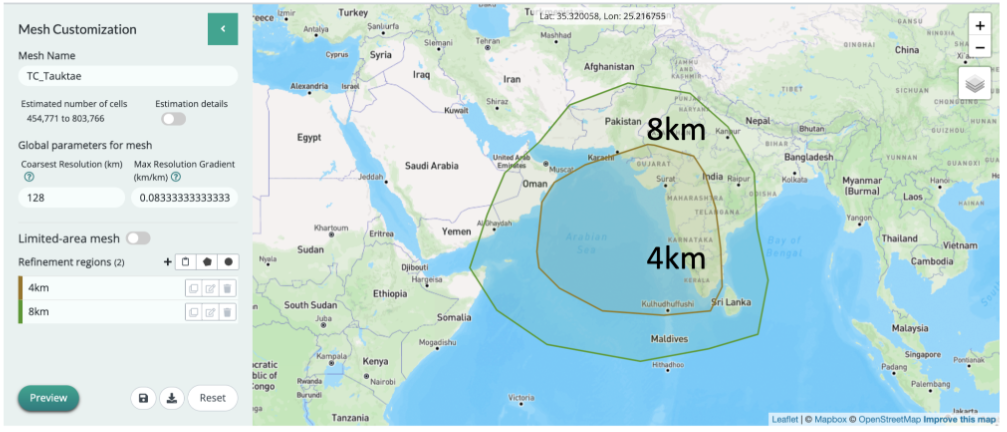
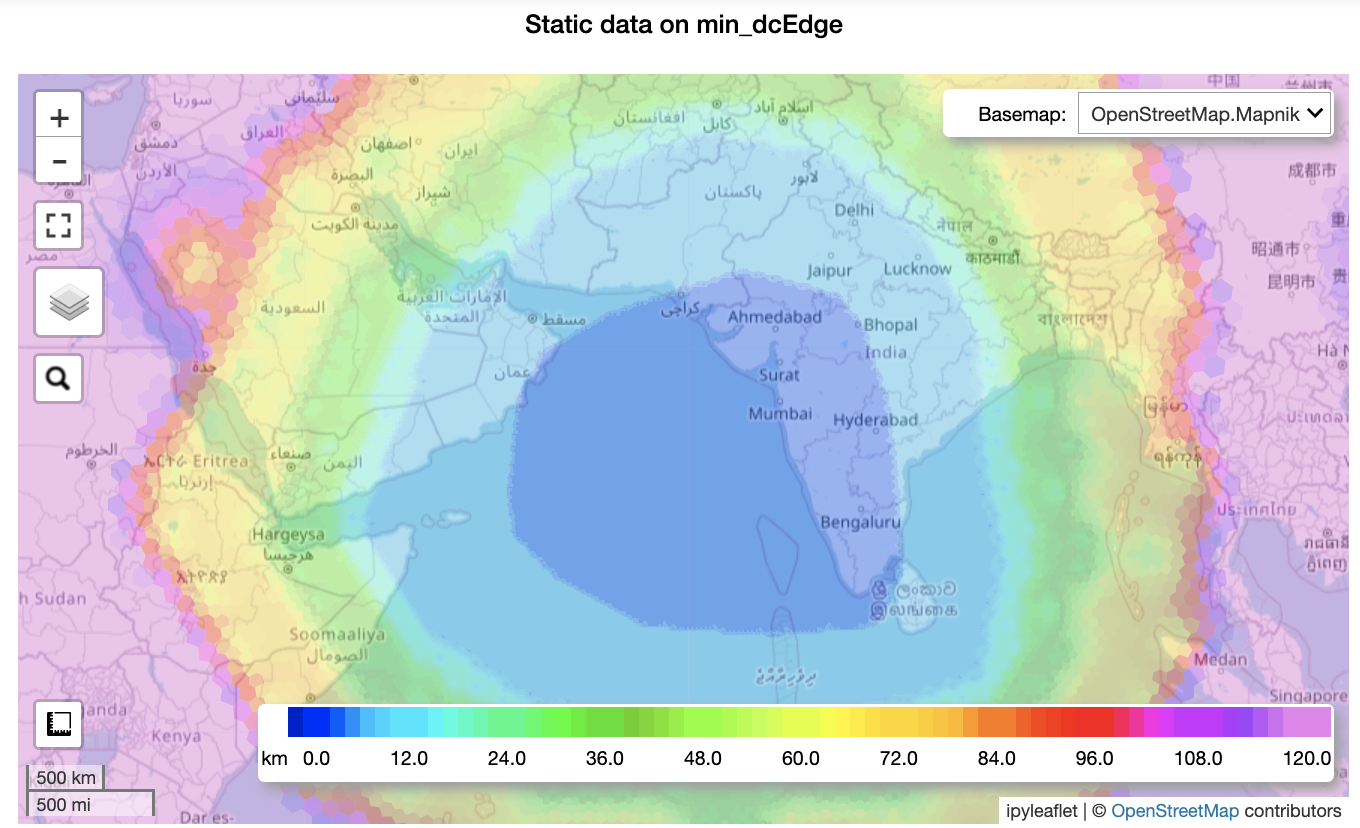
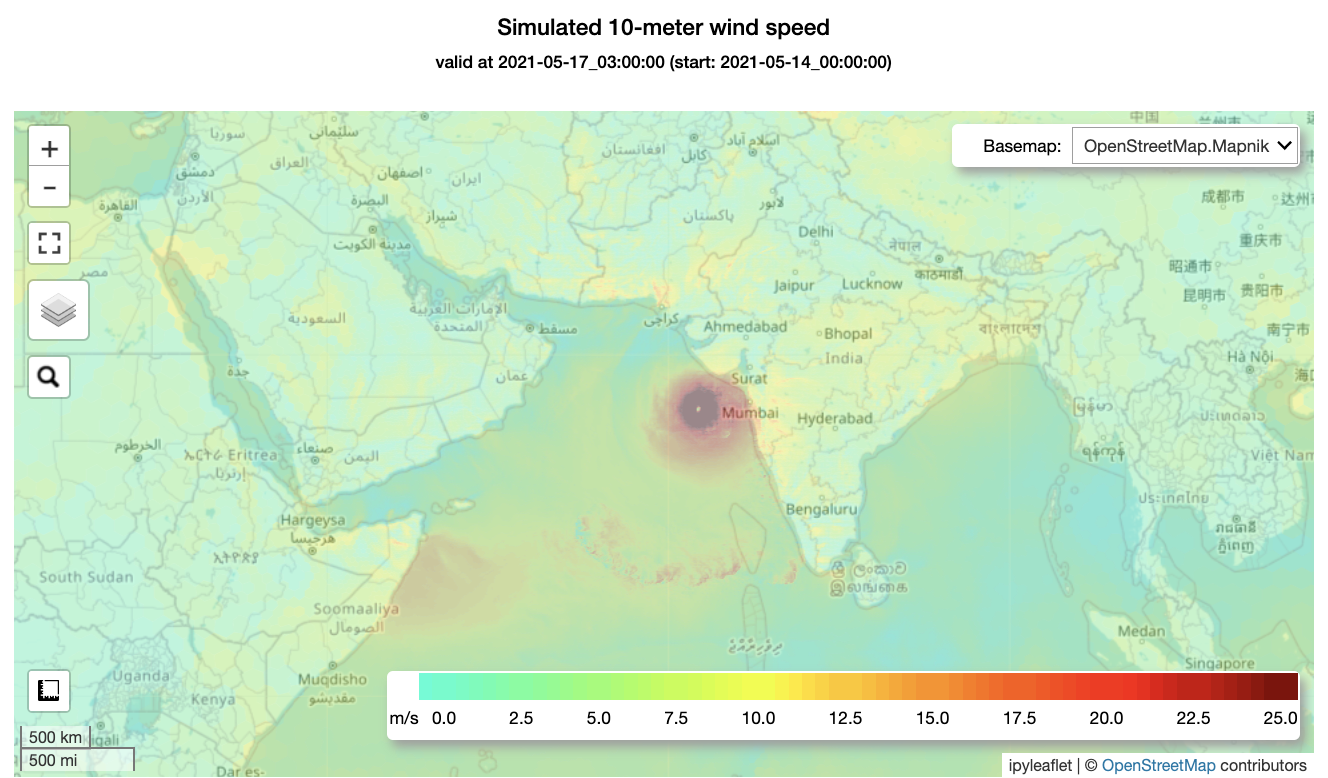
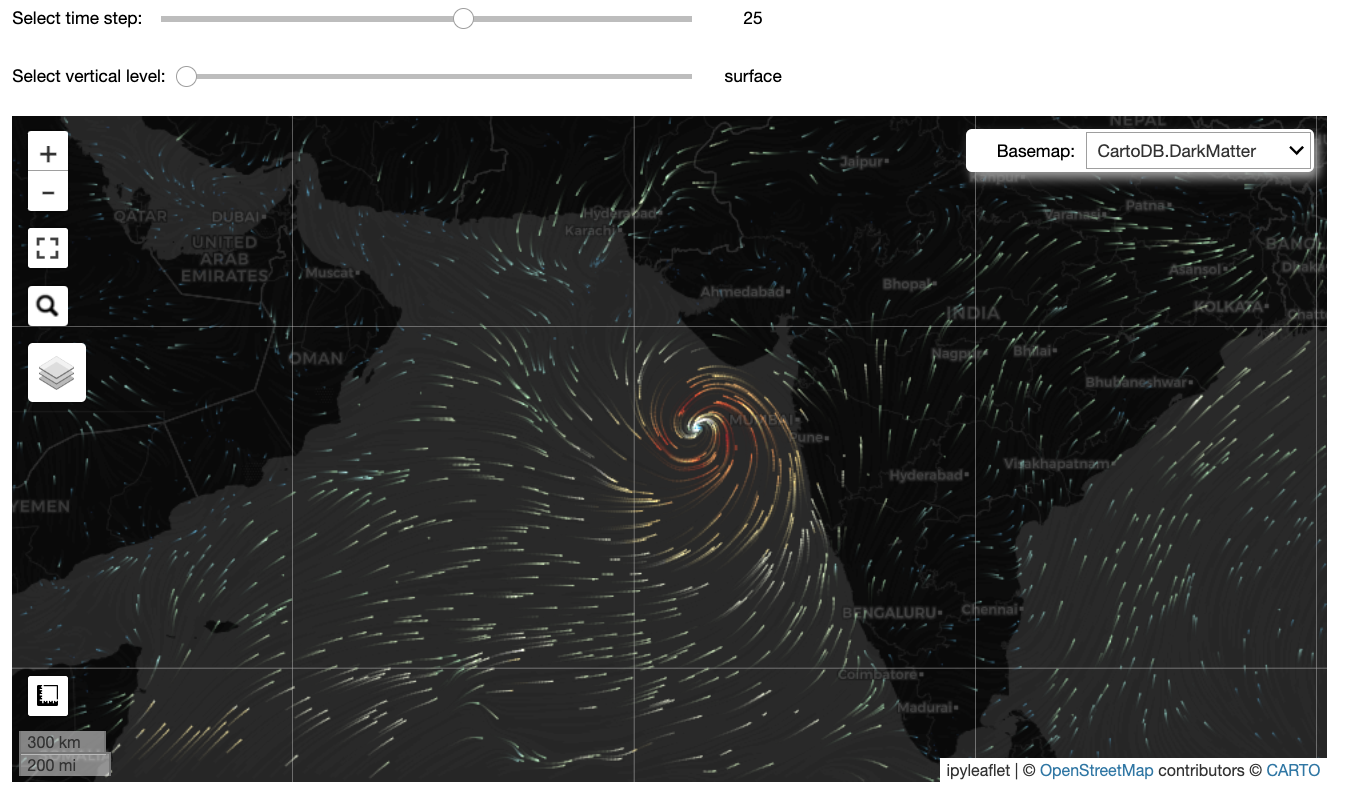
The simulation starts at 00 UTC, 14 May 2021 — when the cyclone was still a deep depression in the Arabian Sea. The simulation covered regions at 4 km and 8 km resolution, including potential cyclone tracks in the Northern Indian Ocean, to predict Cyclone Tauktae. GFS (Global Forecasting System) data is used as initial data, and CPAS output variables are mean sea level pressure, temperature, wind speed, and geopotential height.
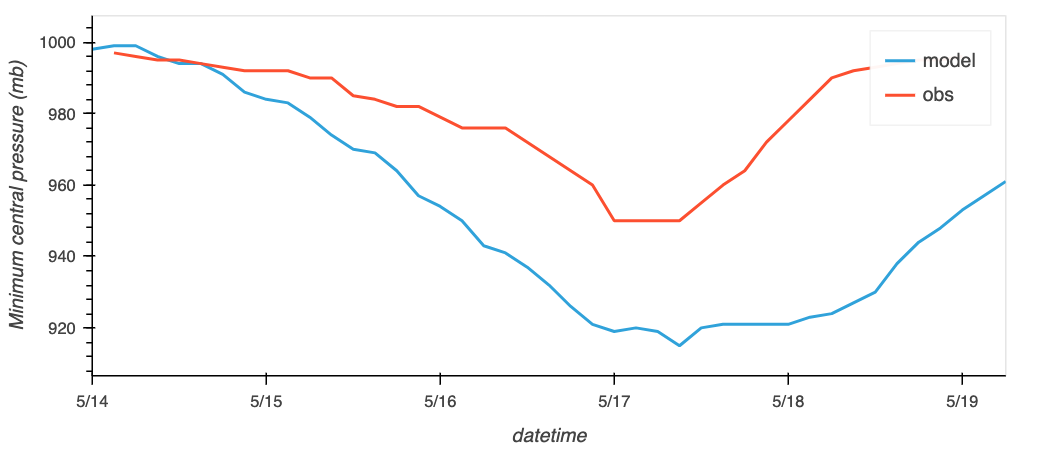
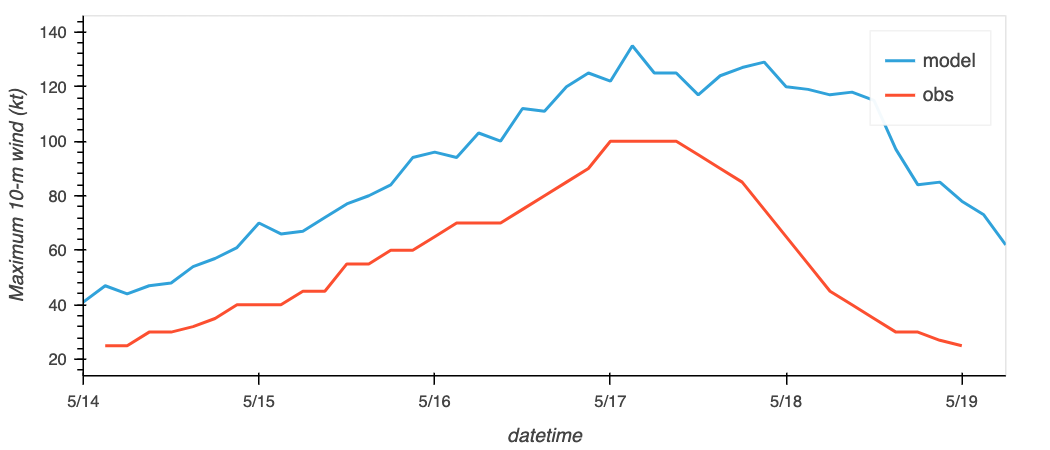
The CPAS global model used GFS initial conditions at 2021-05-14 00:00 (UTC), with an 8–4 km mesh of 366,347 cells (8 km resolution over usual TC tracks, 4 km for orographic and coastal boosts) and mesoscale reference physics schemes. Model output is verified against the NOAA best track and observed peak intensity.
Visual / Demo
Impact
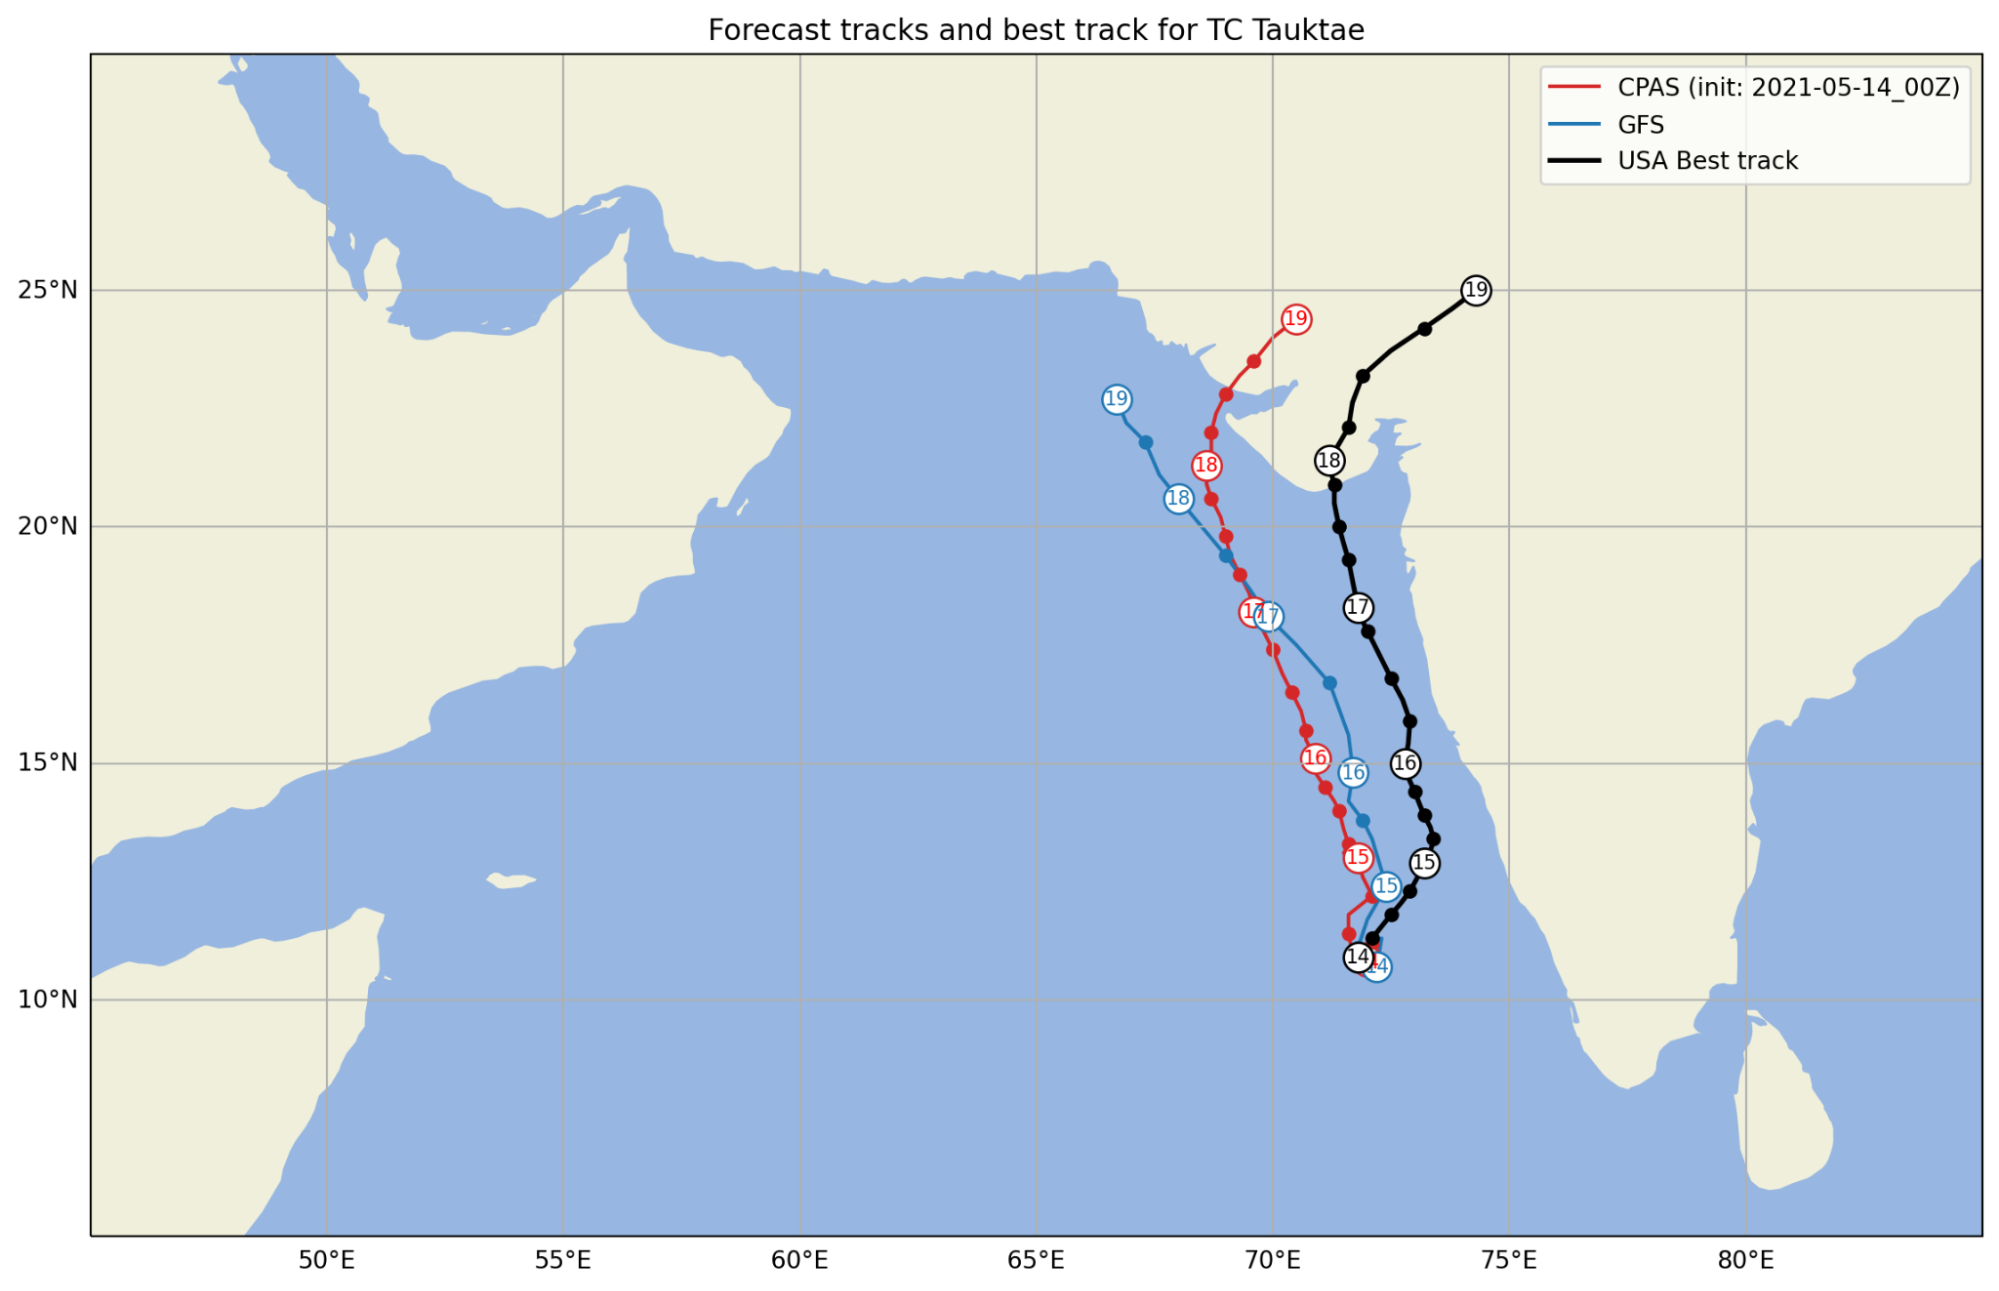
- • The predicted landfall was only a few kilometres west of the best track — higher accuracy than the GFS forecast.
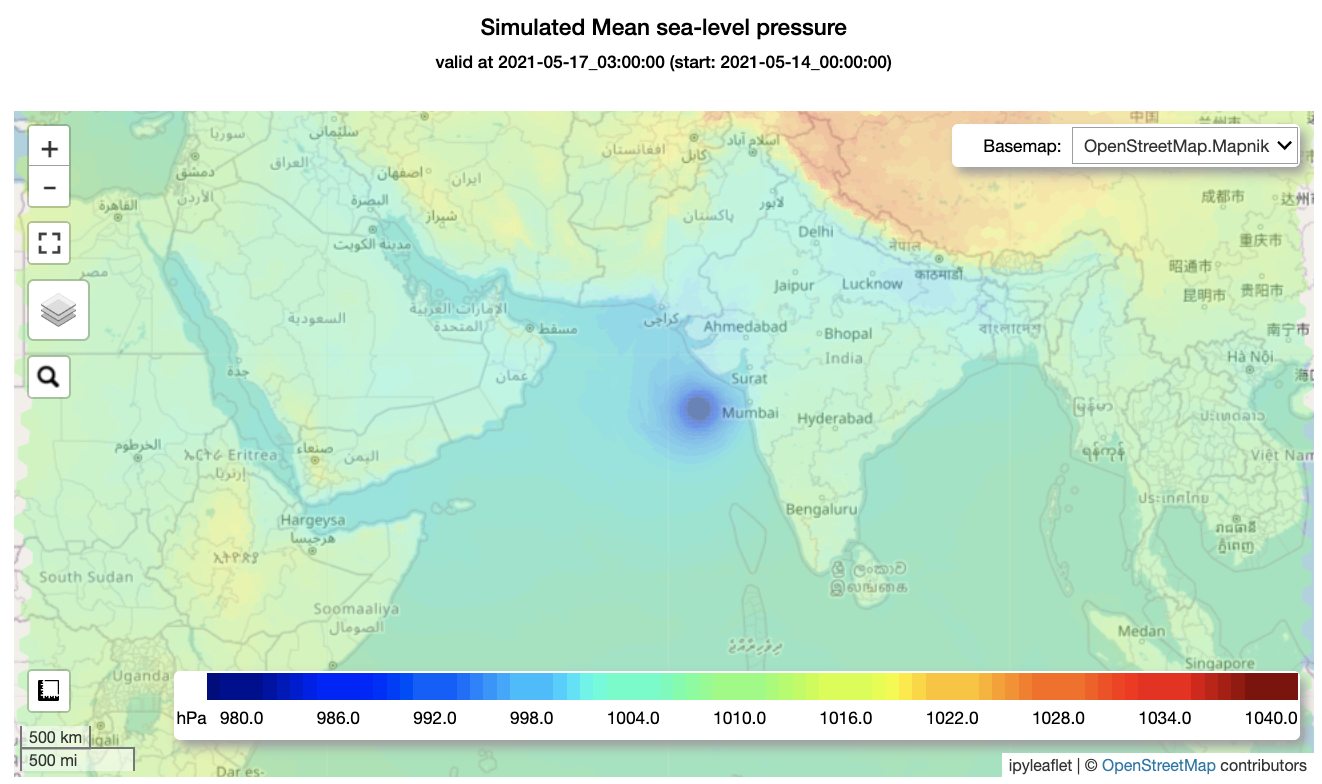
- • At peak intensity CPAS gave a reasonably precise prediction: forecast minimum MSLP ~920 hPa and max sustained wind ~69.4 m/s, close to NOAA's observed 950 hPa and 51.4 m/s.
- • The finer resolution (8–4 km vs. 13 km in GFS) can provide extra detail in short-term TC forecasts, such as finer-scale wind-speed distribution.
The fine-resolution nature of CPAS effectively covered the potential track of the cyclone. CPAS can predict cyclogenesis early in the Indian Ocean using fine resolution and provides satisfactory results.
References
NASA. (2021). Cyclone Tauktae Strikes India. earthobservatory.nasa.gov
TOI. (2021). Tauktae cyclone killed 122, forced 2.6 lakh evacuation in 6 states. Times of India