APAC Energy Opportunities Map
An internal digital platform giving regional leadership a single real-time view of the APAC energy pipeline — designed and built end to end, from requirements and prototype through to handover documentation.
Challenge
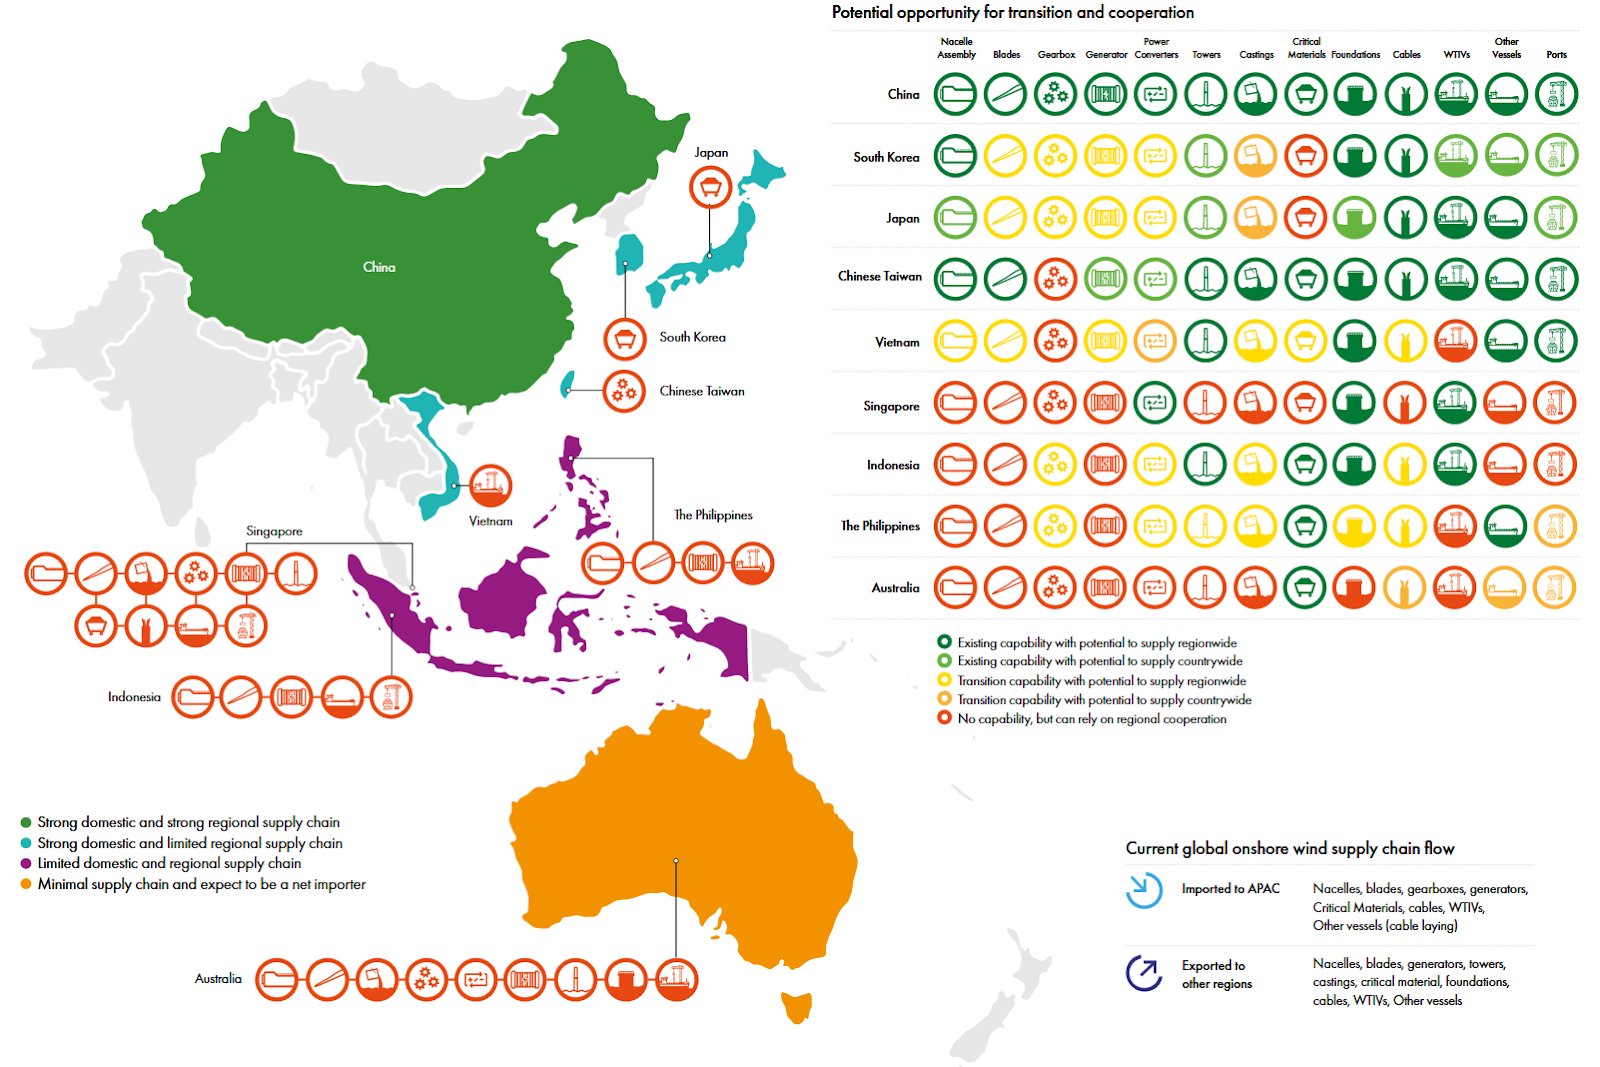
Regional energy leadership had no single view of the opportunity pipeline across BESS, offshore wind, solar and ammonia projects. Tracking lived in spreadsheets, so the pipeline was fragmented, error-prone and out of date by the time it reached a leadership meeting.
Bonnie designed and built the replacement platform end to end — from requirements and prototype through to handover documentation — replacing spreadsheet-based tracking with a governed, real-time product.
Method & Standards
🏗️ Solution architecture
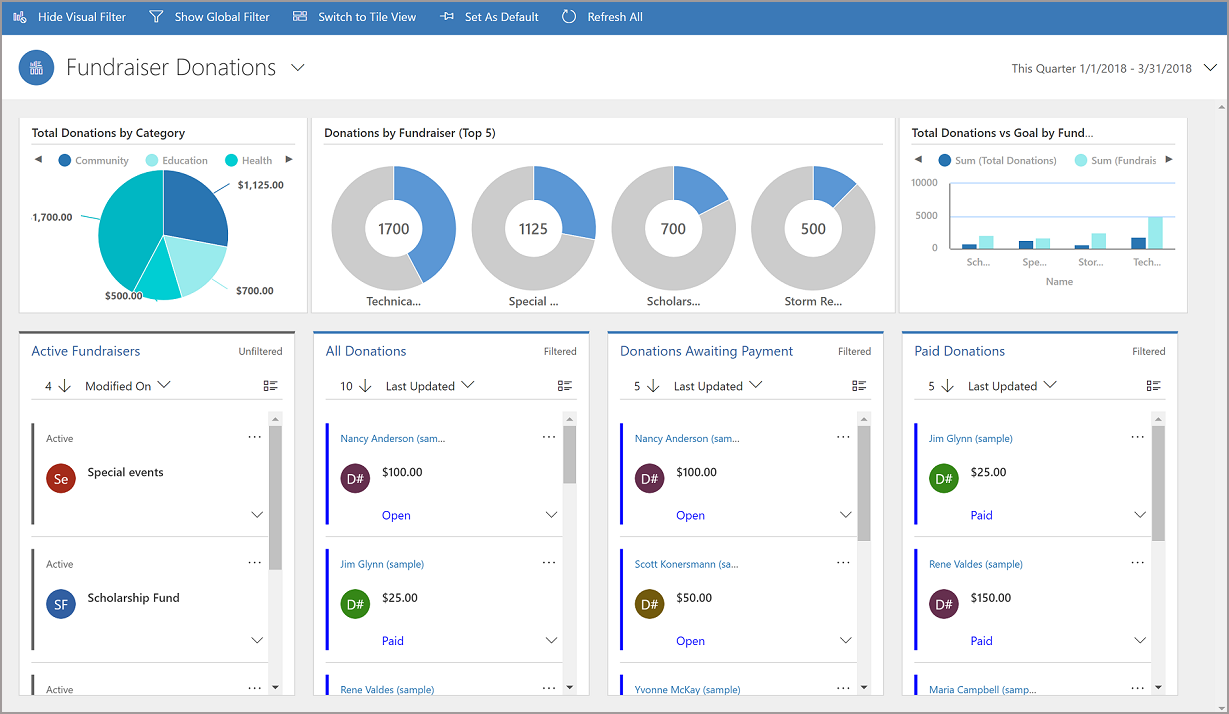
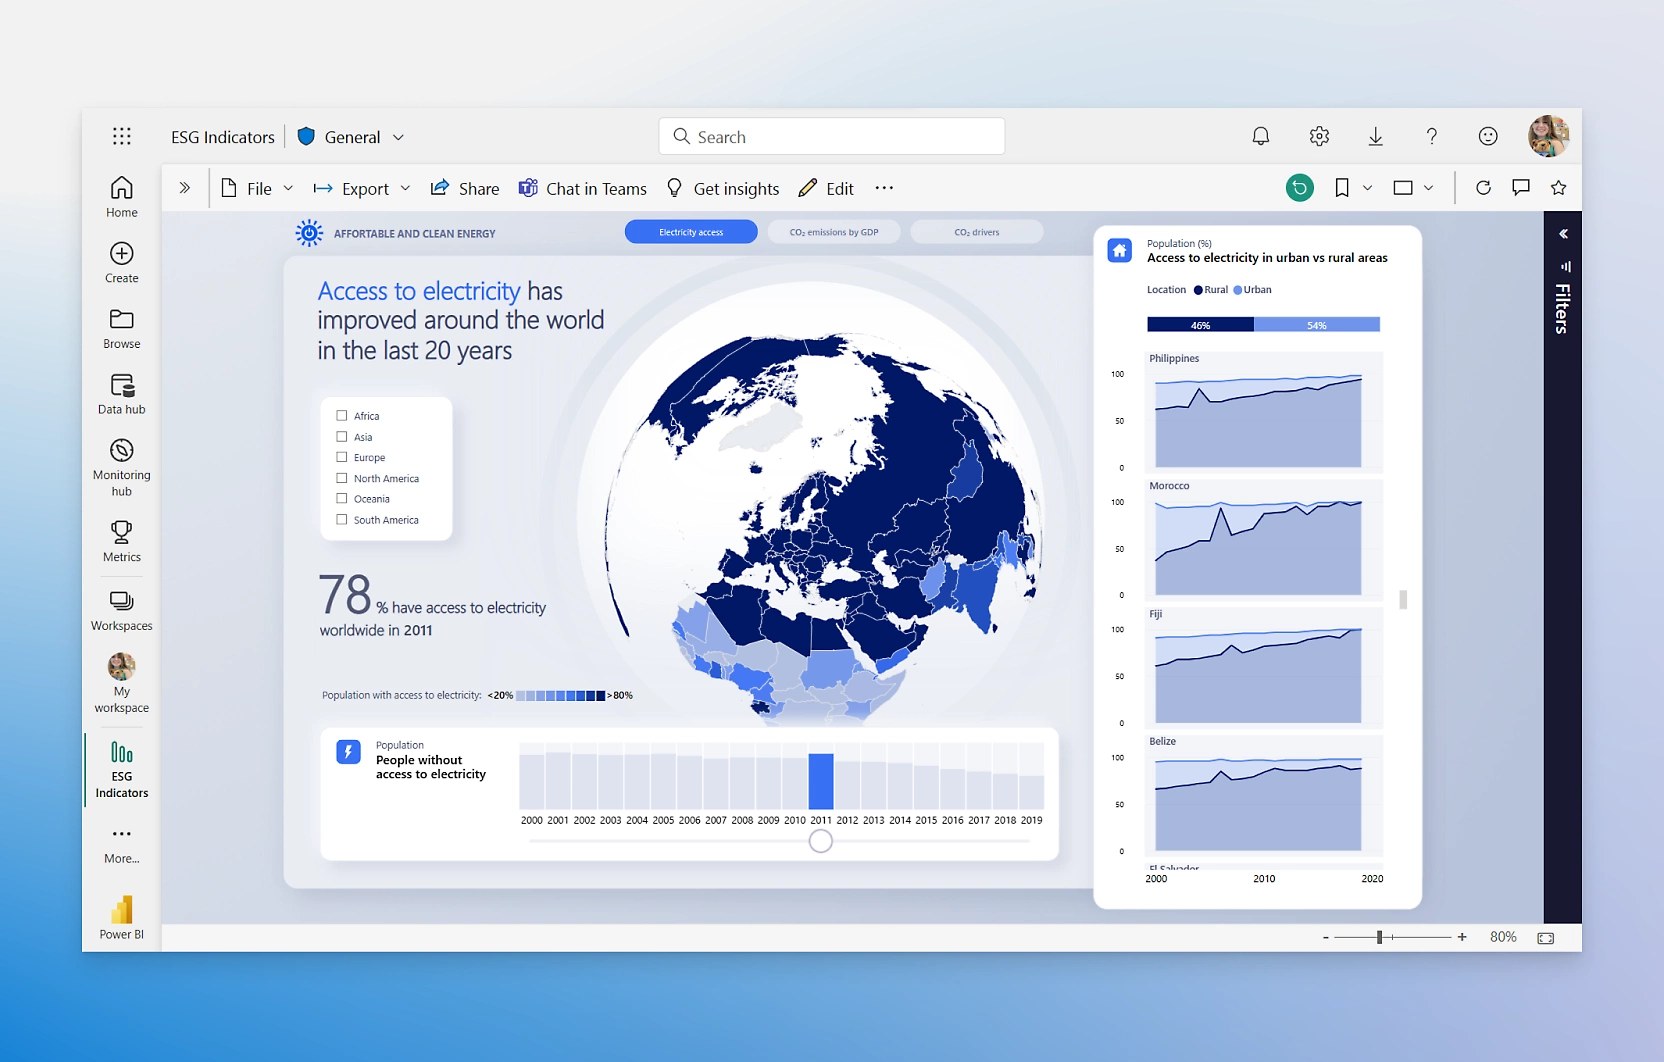
She designed the solution architecture and selected the technology stack — SharePoint / Microsoft Lists as the database, Power Apps as the user interface, Power Automate for scheduled data operations and Power BI for the leadership dashboard — documenting the rationale for each choice against alternatives.
🧩 Product build
She built a responsive Power Apps interface with a searchable opportunity gallery, structured add/edit forms, in-place note threads with author and date stamping, and controlled drop-down taxonomies to enforce data integrity. An automated daily Power Automate backup flow exports the database to CSV into the team SharePoint site, and a Power BI dashboard over the live database gives regional leadership real-time pipeline visibility.
Visual / Demo
Impact
The platform reduced routine reporting effort from around two hours to near-instant and improved data integrity and access control over the previous spreadsheet-based tracking. Bonnie ran the monthly update and comment-register cycle with stakeholders, and produced full user and code documentation plus a formal handover pack on transfer to the Taipei office — so the tool kept running after her move.